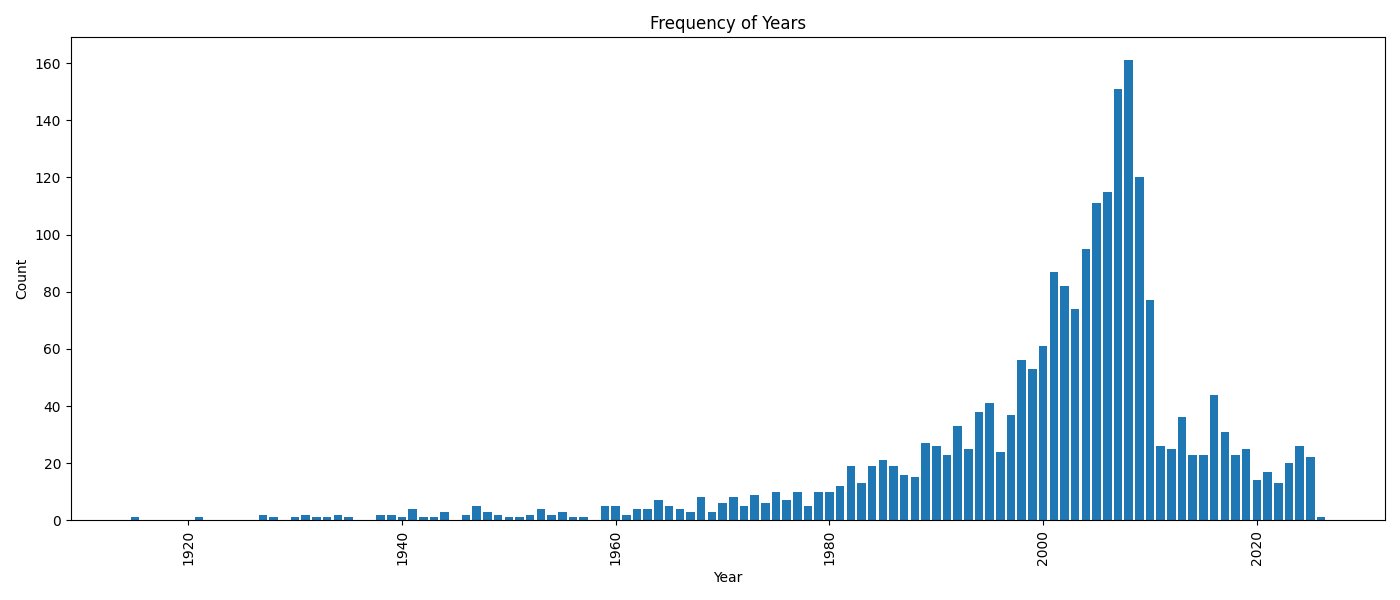
The image is a bar chart titled "Frequency of Years," displaying the count of occurrences for each year from 1920 to 2025. The x-axis represents the years, while the y-axis represents the count. The bars are blue, and the chart shows a significant increase in frequency around the year 2000, peaking at approximately 160 occurrences.